



Transforming Dredge Operations with Real-Time Guidance and Performance Data
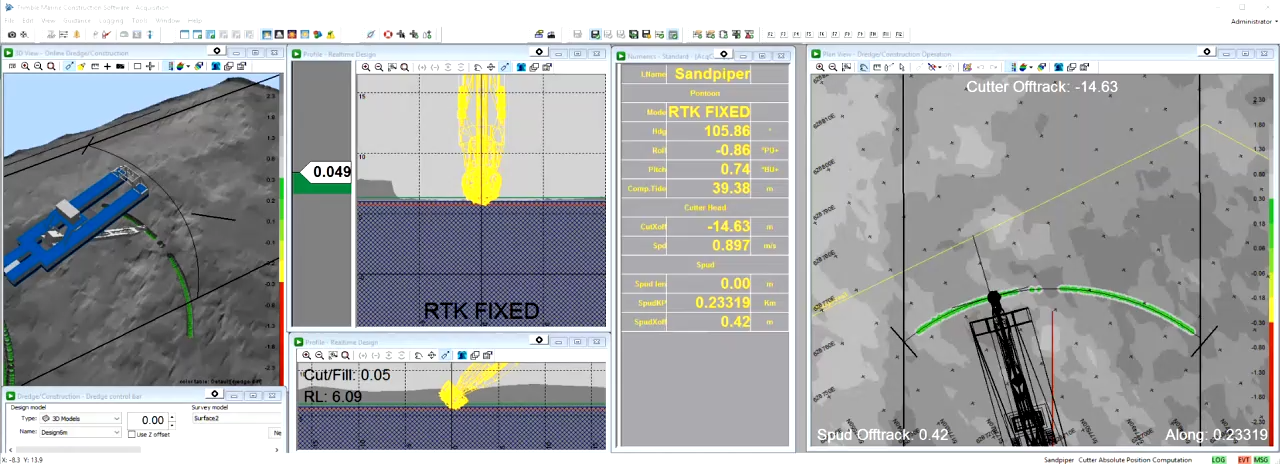
Aggregate mine dredging has traditionally relied on paper maps, manual depth references, operator experience, and periodic surveys. While these methods can support basic production, they may not provide operators with a precise, real-time view of the dredge, the cutterhead, the target material, or the changing bottom. Modern dredge guidance and cloud-based performance platforms can connect positioning, surface models, sonar data, production metrics, and equipment information into one workflow.
Measutronics Corporation leverages Trimble Marine Construction (TMC) software and Trimble, Inc. hardware to deliver advanced guidance systems for aggregate mine dredging operations. Building on the TMC platform, Measutronics developed ConnectedDredge, a solution that provides plant managers with a centralized, real-time dashboard of georeferenced and time-synchronized dredge performance metrics, enabling improved operational visibility and decision-making. This gives operators a clearer picture of what is happening beneath the water while giving managers better access to production and performance data away from the dredge.
The Limitations of Paper-Based Dredging
Aggregate mines often use core-boring information to identify where valuable material is located and how deep dredging should occur in different areas. These target depths can vary throughout a site, and the mine may also need to account for horizontal and vertical permit boundaries, and restricted zones. The challenge is delivering all of that information to the operator in a way that can be easily used during active dredging.
In a traditional workflow, an operator may receive a paper map divided into different zones, with each zone showing an approximate target depth. The map may be taped inside the dredge cab, and the operator may mark completed areas manually. This approach depends heavily on operator judgment because there may be no precise digital record of where the cutterhead has traveled or whether an area was fully covered.
Depth may also be estimated using a ladder board or digital readout. A ladder board functions like a ruler as the ladder moves, while a digital system may calculate depth from a sensor. These methods can still be limited if they rely on a fixed or manually entered water-surface elevation. If the water level changes and the reference is not updated, the displayed depth may no longer reflect the cutterhead’s actual elevation.
Supporting Different Dredge Configurations
A modern guidance system must be able to represent different dredge types and account for the way their working components move. Examples include auger dredges, gantry-style dredges, chain ladder dredges, swinging ladder dredges, and cutter suction dredges.
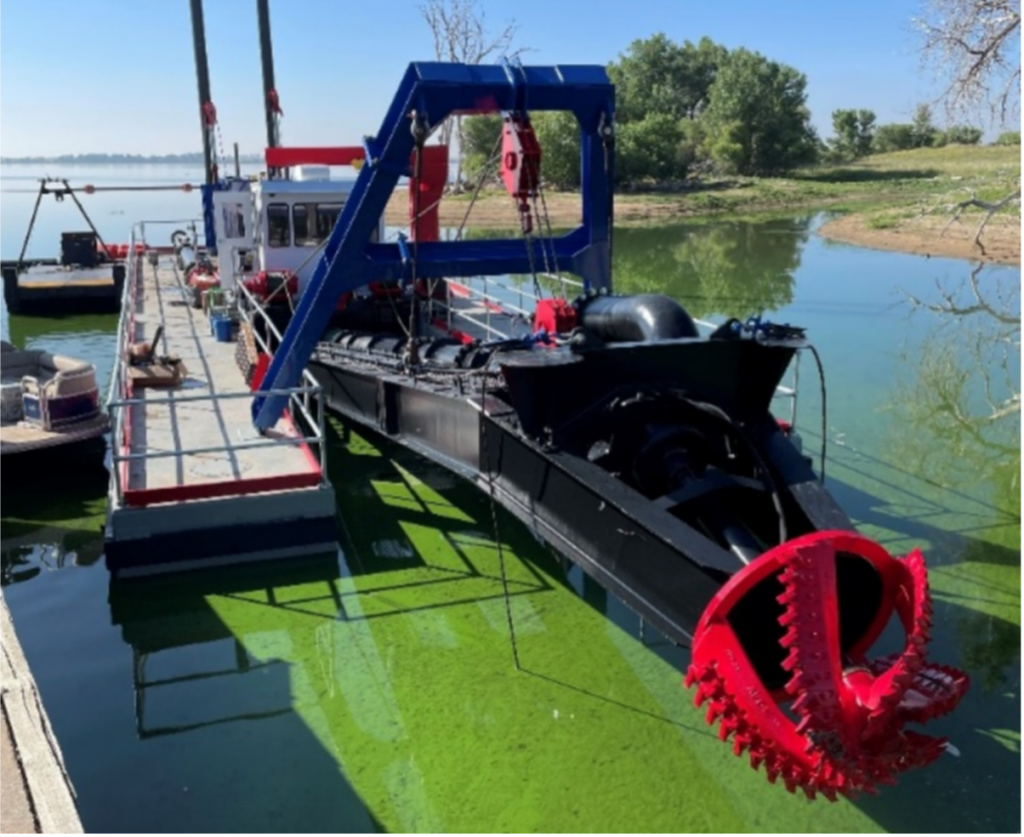
An auger dredge may require the system to model the width of the cutting footprint and the diameter of the wheel. If the lower assembly has another point of movement, an additional sensor can be used to track that articulation. A gantry-style dredge may use rotational encoders to measure wire lengths, bucket elevation, and whether the bucket is open or closed.
A chain ladder dredge has a different working footprint from a cutter suction dredge, so the system must model the chain and cutting area accordingly. A swinging ladder dredge may require an encoder that captures the ladder’s movement to port and starboard independent of the dredge body. The core principle is simple: when a component moves and that movement can be measured by a sensor, the system can usually represent its position within a digital model.
Establishing Dredge Position and Orientation
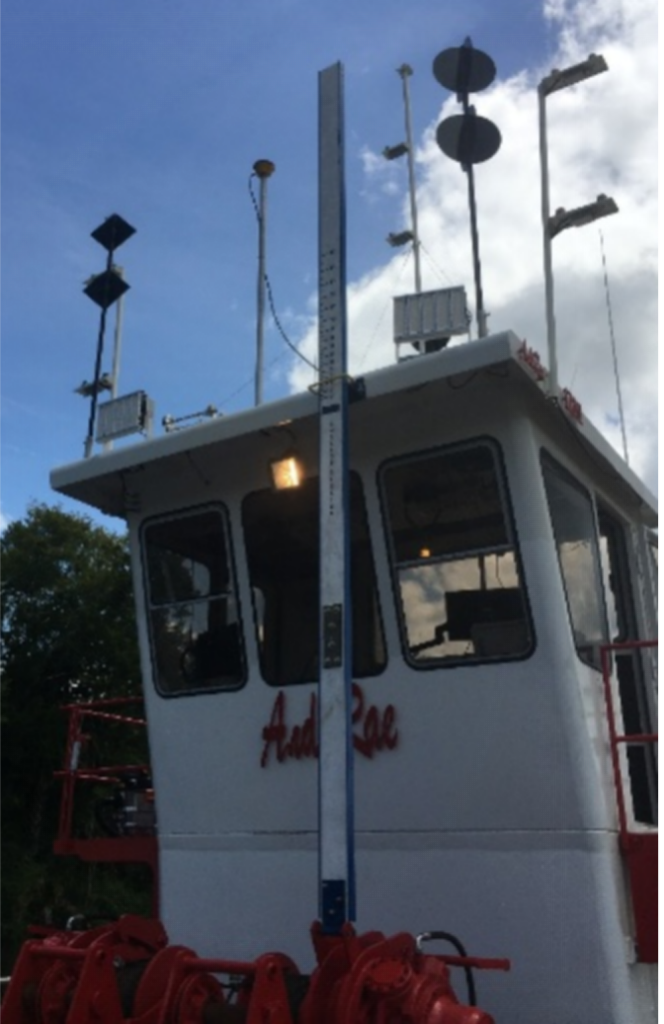
The guidance process begins with establishing the dredge’s position and orientation. A dual-antenna Global Navigation Satellite System (GNSS) setup can be used for this purpose, with one antenna providing position and the second helping determine heading. A pitch-and-roll sensor can also account for the movement of the dredge as it works through the material.
Once the dredge position and orientation are known, measured offsets can be applied to determine the location of the trunnion. A ladder sensor, installed in a rugged submersible enclosure, measures the ladder angle. With the trunnion position, ladder length, and ladder angle established, the system can calculate the position of the cutterhead.
Several GNSS correction options may be used for positioning. A local base station can provide high reliability and accuracy, but it requires additional hardware, setup, and maintenance. Another option is Differential GPS (DGPS) positioning combined with a manually entered water-surface elevation, although accuracy depends on how recently the elevation was updated.
A satellite-based correction service can reduce operator involvement while still providing positioning accuracy suitable for many aggregate mine applications. Once the system is calibrated and commissioned, it can continuously account for changes in water-surface elevation without requiring frequent manual adjustments.
Tracking Cutterhead Coverage and Depth
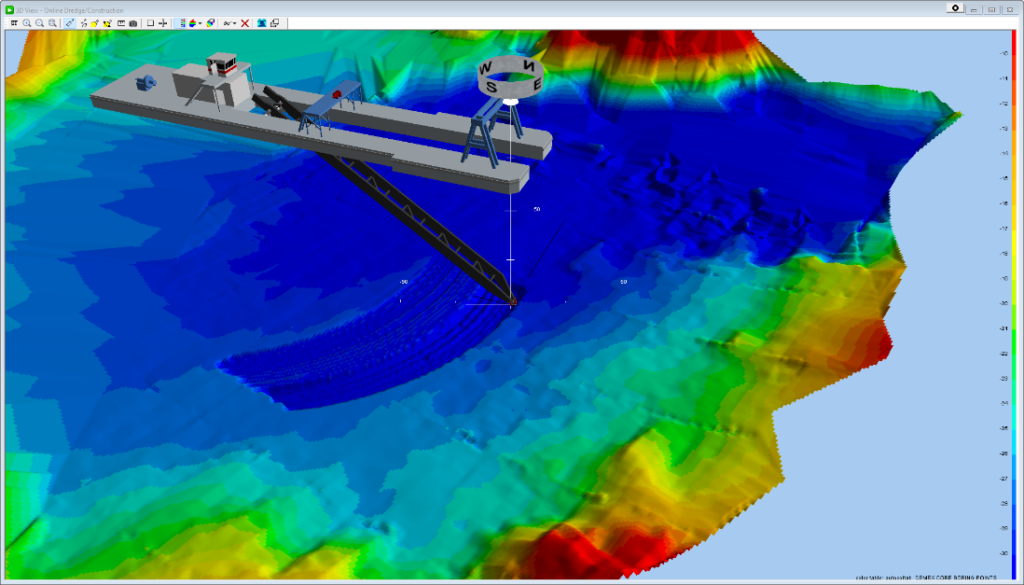
Even without bathymetric data, a guidance system can create a digital record of where the cutterhead has worked and at what depth. As the operator swings the cutterhead, the software records the resulting coverage. If an area is missed, the gap appears between the recorded passes, allowing the operator to complete that section before moving farther into the cut.
This provides a major advantage over manually marking a paper map. The digital record can also support shift changes because an incoming operator can see where the previous shift worked without relying entirely on verbal instructions or handwritten markings.
Profile views can display the recorded cutterhead path beneath the water, while core-boring information and a target depth band can also be shown when those datasets are available. This type of setup does not directly measure the current bottom because it records where the modeled cutterhead has traveled. Even with that limitation, it gives the operator a more consistent record of coverage and depth than a paper-based workflow.
Adding Bathymetric and Core-Boring Data
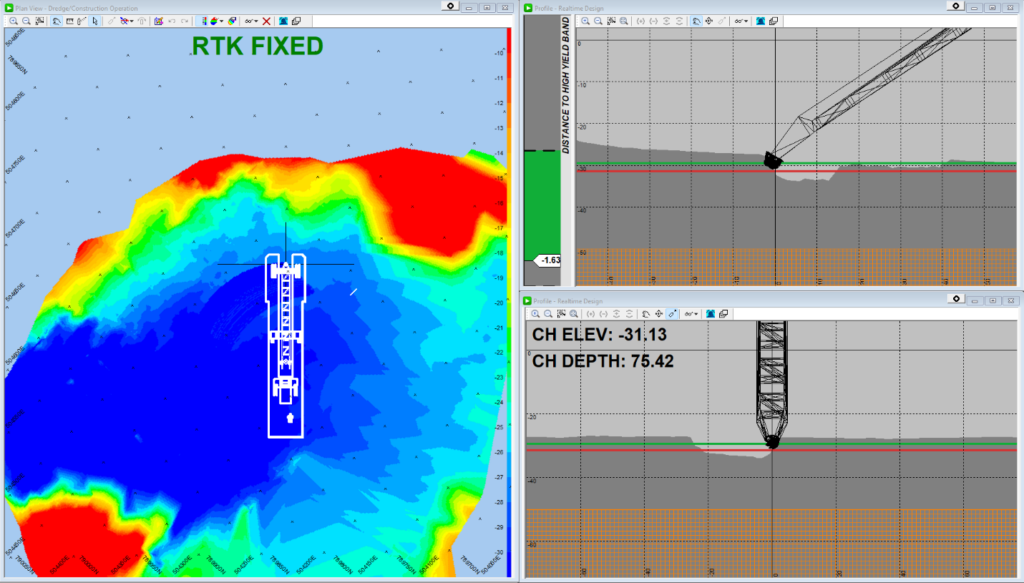
The system becomes more useful when bathymetric survey data is imported into the dredge guidance software. The operator can then see the existing ground surface ahead of and beside the cutterhead. As the modeled cutterhead moves through the material, the software updates the represented surface by removing the material within the cutterhead’s path.
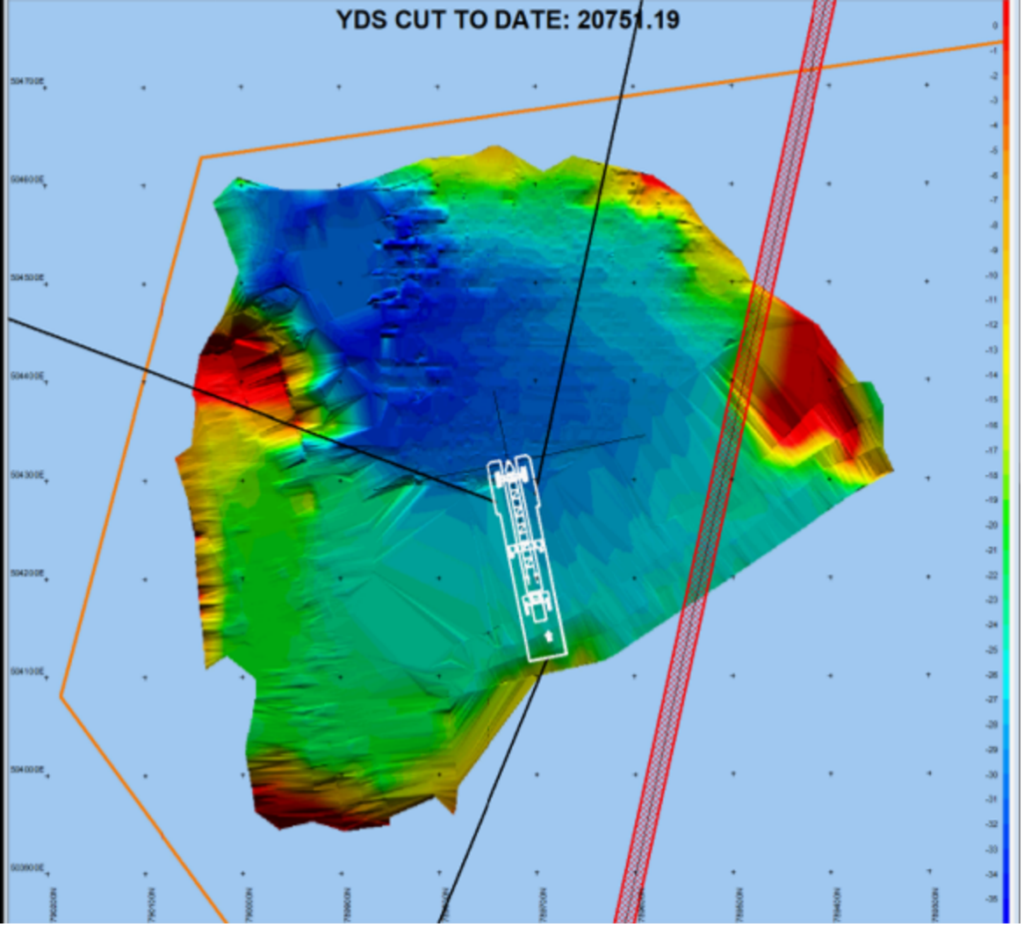
Colors can be assigned according to elevation. For example, shallower areas may be shown in red while deeper areas appear in blue, and the color ranges can be configured for the site and target depths. Permit boundaries and core-boring information can also be added to the same view.
The operator may be shown a desirable material band between two surfaces, along with a lower boundary that must not be crossed. Another useful display colors the surface according to its difference from the target. This delta view can show where more material remains, where the cut is within tolerance, and where the cutterhead has moved below the intended depth.
Core-boring points can also be used to generate a target surface. That target can then be compared with a recent bathymetric surface to identify areas where material may remain, even in sections previously considered complete.
Accounting for Changes in the Bottom
Tracking cutterhead movement does not account for every change that can occur underwater. Aggregate mine bottoms are dynamic, and material may cave off, settle, slough, or move after the cutterhead has passed through an area. A guidance display based only on cutterhead movement may therefore differ from the actual bottom over time.
Periodic bathymetric surveys provide a direct measurement that can be used to update the surface model. A single-beam sonar measures depth directly beneath a survey boat as it travels along survey lines, while the surface between those lines is interpolated to create a surface model. This can provide useful information about general bottom contours, but it does not offer complete coverage between the survey lines. A hole, boulder, or other feature may exist where the boat did not pass.
Multibeam sonar provides a denser three-dimensional view of the bottom. It is more complex and costly, but it can produce full bottom coverage and a detailed point cloud. Where a single-beam survey may identify a general feature when the vessel passes directly over it, multibeam data can reveal much more detail about the feature and the surrounding area.
Data from either survey method can be imported into the guidance system to refresh the surface model. The limitation is timing. At some sites, hydrographic surveys may occur quarterly, annually, or even less frequently. Data collection, processing, delivery, and import can create a delay between the actual bottom change and the operator receiving the updated information.
Bringing Sonar onto the Dredge
Mounting sonar directly on the dredge can reduce the delay between bottom changes and surface model updates. In one configuration, a multibeam sonar is installed in a fixed position on the dredge. As the dredge swings, its motion allows the sonar to scan different portions of the bottom, and the collected data can update the guidance surface in real time.
This gives the operator a direct measurement of the current bottom. It can reveal a cave-off, hole, mound, or other change that would not be reflected by cutterhead tracking alone. Real-time processing involves tradeoffs because some noise may remain when the data must be filtered and displayed quickly. For many aggregate mine applications, the value of immediate information may outweigh the need for a highly polished survey product.
Another configuration places the sonar on a mechanical rotator. Instead of relying only on movement of the dredge, the operator can change the sonar’s viewing angle. This makes it possible to inspect either side of the cutterhead or point the sonar toward a suspected bottom change without repositioning the entire dredge.
Sonar placement must be planned for each dredge. Water depth, dredge arrangement, cutterhead location, and required coverage all influence where the sonar should be mounted. The goal is to reduce interference while obtaining a useful view of the working area.
Calculating Material Volumes
A dredge guidance system can compare two gridded surfaces and calculate the volume between them. For example, a mine can compare bathymetric data from two different periods to estimate how much material was removed. A recent survey can also be compared with a target surface developed from core-boring information to estimate how much material remains.
The resulting report can include maps, calculated volume, area, and related data. The result should not be treated as a perfect measurement because accuracy depends on the quality, density, and timing of the underlying survey data, along with the way the surfaces were created. Even with those limitations, surface-to-surface volume calculations can provide useful information for production review, planning, and progress tracking.
Creating Restricted Areas and Alerts
Guidance software can also display restricted areas, including both two-dimensional zones and three-dimensional objects. A two-dimensional area might represent a reef, submerged cultural resource, or another location where dredging is not allowed. A three-dimensional object could represent a submerged pipeline.
The software can display restricted areas, show the dredge’s distance from them, and provide visual warnings as the cutterhead approaches. Because on-screen warnings are only effective when the operator is actively watching the display, Measutronics Corporation developed StackLite, an external light system that can trigger an additional visual warning, along with an optional audible alarm. Warning distances and danger thresholds can be configured for the application. As the dredge moves closer to the restricted area, StackLite can change to draw the operator’s attention before the cutterhead enters the danger zone.
Moving Dredge Data into the Cloud
Operator guidance addresses what is happening on the dredge, while a connected cloud platform can extend that information to managers and other personnel working remotely. A computer module installed on the dredge can collect data from the guidance system, including position, heading, corrected depth, and elevation.
The module can also connect to a third-party sensor or programmable logic controller. This allows it to collect operational information such as velocity, density, tank levels, temperatures, and other values tracked by the dredge’s PLC. Some edge processing can be performed on the dredge to clean, organize, and package the data before it is sent to the cloud.
The cloud platform can then provide historical and current views of dredge activity without requiring managers to be physically present on the dredge. This creates a direct connection between field operations and management oversight.
Connecting Production with Time and Position
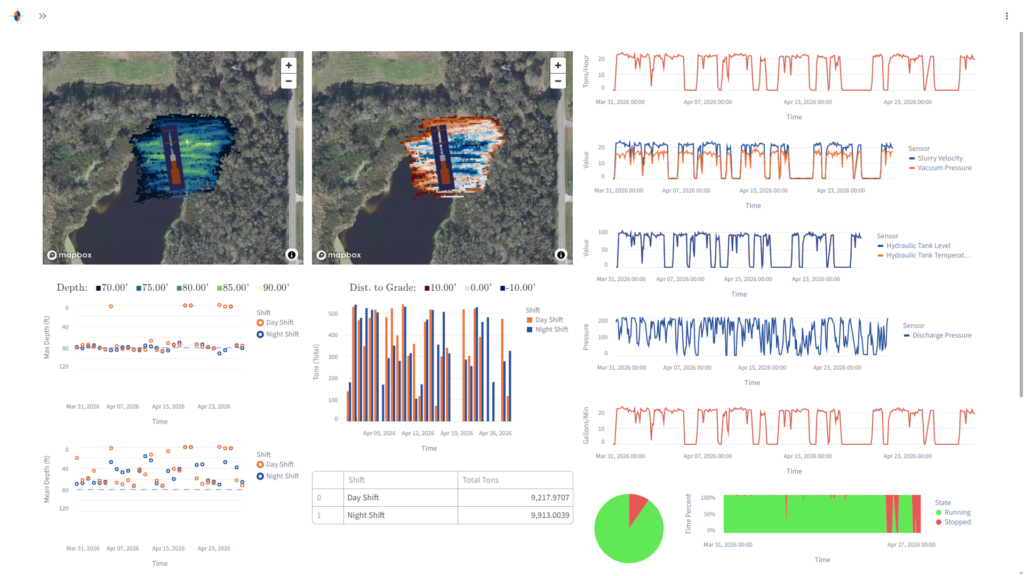
Measutronics Corporation’s ConnectedDredge platform displays georeferenced time-series information such as production, velocity, density, uptime, and downtime. These charts help users understand normal operating patterns and recognize unusual spikes, drops, or other anomalies.
Incoming information is time-stamped and synchronized, ConnectedDredge can associate an event of interest with both when and where it happened. This makes it possible to create heat maps showing information such as the deepest recorded cutterhead position or the amount of production associated with different parts of the site.
A manager may use these maps to identify areas with higher or lower production and investigate the cause. Similar geographic views can be developed for other available values, including flow velocity, density, temperature, or other data collected from the PLC.
Comparing Shifts and Monitoring Performance
The ConnectedDredge platform can also break production data down by shift. Instead of showing only total daily production, the system can display how much each shift produced during a day, week, or month. This information can help managers identify whether a difference resulted from planned maintenance, operating conditions, or a consistent performance gap. If a pattern appears, management can investigate further and determine whether training, maintenance, or another response is appropriate. Dashboard views can include average depths and tons produced by shift, and the exact arrangement can be customized according to the information a company needs to monitor.
Sending Text and Email Alerts
ConnectedDredge can send text or email alerts when selected data crosses a defined threshold. This supports the same type of anomaly detection shown in the dashboard, but it does not require someone to continuously watch the screen. The objective is to make personnel aware of a developing issue while it may still be relatively small. Alerts can also apply to the guidance system. If the dredge loses its GNSS position, for example, the system can generate a notification so the issue can be addressed.
Reviewing Data Across Different Timeframes
ConnectedDredge includes a time slider that allows users to change the period represented across charts and maps. A user may narrow the view to a few hours or a day, or expand it to a week, month, or longer period. As the timeframe changes, the maps, bars, points, and line graphs update to reflect the selected period. Because the data is continuously logged, managers can review a narrow operating event or examine broader trends using the same dashboard. Companies operating multiple dredges can also compare data from several sites, moving between a fleet-level view and a more detailed view of an individual dredge.
Supporting Different Equipment and Reporting Needs
Connected monitoring systems are not limited to one dredge manufacturer. The primary requirement is access to the necessary data and a clear understanding of where and how to retrieve it from the machine.
When the required sensor, guidance, or PLC data is available, it can be collected, processed, and incorporated into the platform. The same data-handling process can also support reporting requirements that depend on collecting, packaging, and transmitting dredge information to an external server.
Compatibility depends on the required data format, system configuration, and reporting standard. However, the overall approach can be adapted across different dredge fleets and operating environments.
ConnectedDredge can also be used to fulfill U.S. Army Corps of Engineers (USACE) Dredging Quality Management (DQM) requirements.
Building a More Informed Dredging Workflow
Modern dredge guidance and connected performance platforms address different levels of operation. The guidance system provides the operator with positioning, cutterhead tracking, target surfaces, permit boundaries, restricted zones, bathymetric information, and potentially real-time sonar updates.
The cloud platform uses guidance and PLC data to give managers access to production information, historical trends, geographic heat maps, alerts, shift comparisons, and multi-dredge monitoring. Together, these systems create more than a digital replacement for a paper map.
They create a connected workflow that combines the operator’s view of the underwater work with the manager’s view of production and equipment performance. By bringing positioning, surface data, sonar measurements, and operational metrics together, dredging teams can make decisions using a more complete record of where the dredge worked, how deep it worked, what the bottom currently looks like, and how the equipment performed over time.
