


Panama Canal’s 3rd Crossing Foundation Optimization with Loadtest O-Cells

View the complete article here.
Colón, Panama
William F Knight, PE, Business Development Manager
Brian Haney, PE, Regional Manager
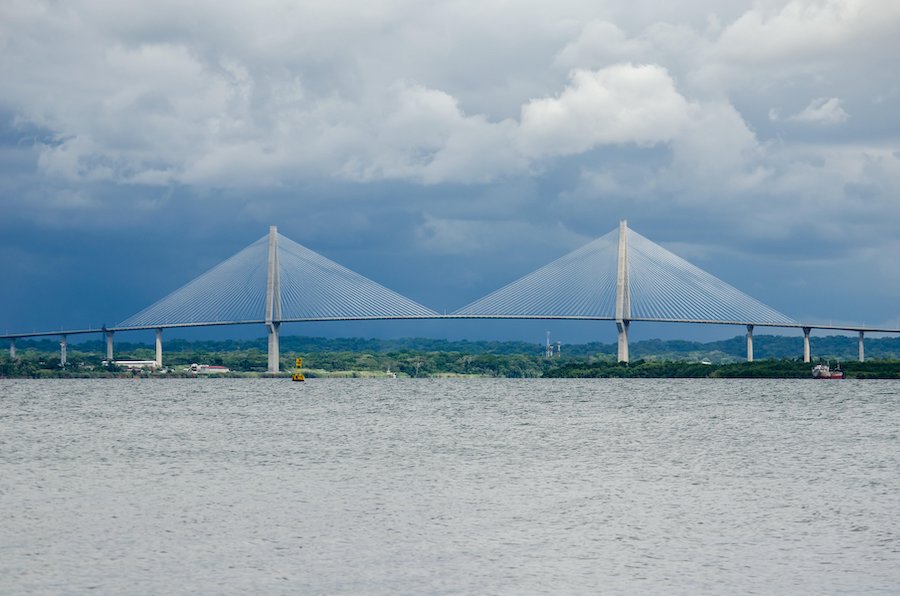
Addressing the need for improved surface travel access between eastern and western Panama, the Panama Canal Authority commissioned a new third Panama Canal crossing bridge at Colón on the Atlantic side. Historically cross canal transportation depended on ferry service and one lane roadways subject to the operations of the Gatun and Agua locks. This dependence often caused agonizing long travel delays, even during medical emergencies for this side of the country.
Located 3 km from the Gatun locks this third canal crossing entailed 3.1 km of exceptionally engineered structure with approach and feeder highways and structures. Spanning the canal and accommodating Post-Panamax container vessels required the structure to have a vertical clearance of 75 meters and a main span length of 530 meters. These requirements could only be delivered by a world record cable stayed bridge with foundations sized to meet the mega structural, vessel impact and seismic loadings. Maintaining foundation economic viability demanded design optimization with actual measured performance rather than those assumed from textbook design methods.
VINCI, commissioned to deliver the $348 million project, drew heavily on its subsidiaries for the construction; VINCI Construction Grands Projects for the bridge, Soletanche Bachy subsidiary Rodio Swissboring Panamá for the deep foundations and Freyssinet for the cable stay installation.
As part of the design team, CCCC Highway Consultants and the Louis Berger Group (now WSP) assembled and evaluated existing geological and geotechnical information and enhanced it with additional studies for the geotechnical design. This included evaluation of the project for detrimental influence from seismic events.
In the geology where the foundations would be placed four geologic units (zones) were identified from the geotechnical information: the rock substrate being the Gatun Formation, Atlantic Muck quaternary deposits, residual soils from in situ rock alteration and manmade filling.
The Gatun Formation has a layer of weathered fossiliferous sandstones on the surface of medium-fine grained sandstones with consolidated ash layers, marine shale and conglomerates with possible faulting identified from layer irregularities, about 5 m, in some locations. For the main bridge East zone, the discovered depths ranged from 19.5 meters to 36.5 meters. For the main bridge west zone drillings indicated rock located from between 6.5 meter and 16-meter depths.
The residual soils created by weathering of the rocky massif are grey to green-grey in color, moderately low to moderately high consistency and high natural water content, it has high plasticity silts and small weathered rock fragments that extend throughout the rock substrate with thicknesses up to 6 meters on the east and thinning to 2 meters on the west.
Atlantic Muck composed of layers of grey to black silts, silty clays and clays, dark-brown to black very fine-grained silty sandstones with decomposing organic remains and bioclasts. Ranging from very low to moderately low consistency, with a very high natural humidity content, these quaternary deposits were identified during the drillings in thicknesses up to 14.5 meters on the east and 11 meters to the west.
Fill composed mainly of silts, fine sands and clays, mixed with roots and rock and shell fragments with a moderately low to moderately high consistency, low plasticity, high natural water content and green to brown color. Thicknesses ranged from 2 to 12 meters on the east and from 1.5 to 10.5 meters on the west side. One instance of hydraulic fill composed of brown to dark grey clays, silts and fine sands mixed with discarded materials and rock fragments, varying from very low to moderately high consistency with a high natural water content, occurs as a single layer on the east side reaching depths of 9m.
The location’s proximity to the Atlantic Ocean created an environment that made the Panama Canal Authority desire a concrete structure. The afore mentioned record span length and vertical clearance required 210-meter-high cable stay towers. Erection of the world record cable stay concrete main span across the canal without interfering with shipping traffic required use of innovative form travelers each weighing 240 metric tons.
The high loads from the record span length, the tall cable support towers, weight of the specialized erection equipment and seismic influence combine to make design by a standard geotechnical AASHTO Code approach cost and schedule prohibitive. Recognizing the financial and schedule limitations, the performance of direct measurement of foundation behavior with in-situ loads was chosen for foundation design optimization.
Desiring a true measurement of the deep foundation geotechnical behavior under load the team called on Fugro Loadtest to perform the deep foundation load testing for this signature structure. Fugro Loadtest used genuine O-Cells to apply the loads to the test foundations. Accomplishing the test program within the required schedule made careful planning between Puente Atlantico SA and Loadtest a key to successful implementation.
Developing a load test program to supply the design parameters questions needed for foundation optimization is Fugro Loadtest’s forte. Drawing then on over 25 years of foundation testing experience, Loadtest developed a test program that measured the actual foundation responses within the realm of the design needs. The program developed incorporated six bored piles, half on each side of the canal. A test program, with test piles with diameters of 1,500 mm, 1,800 mm and 2,500 mm with depths ranging from 30 to 54 meters, was planned.
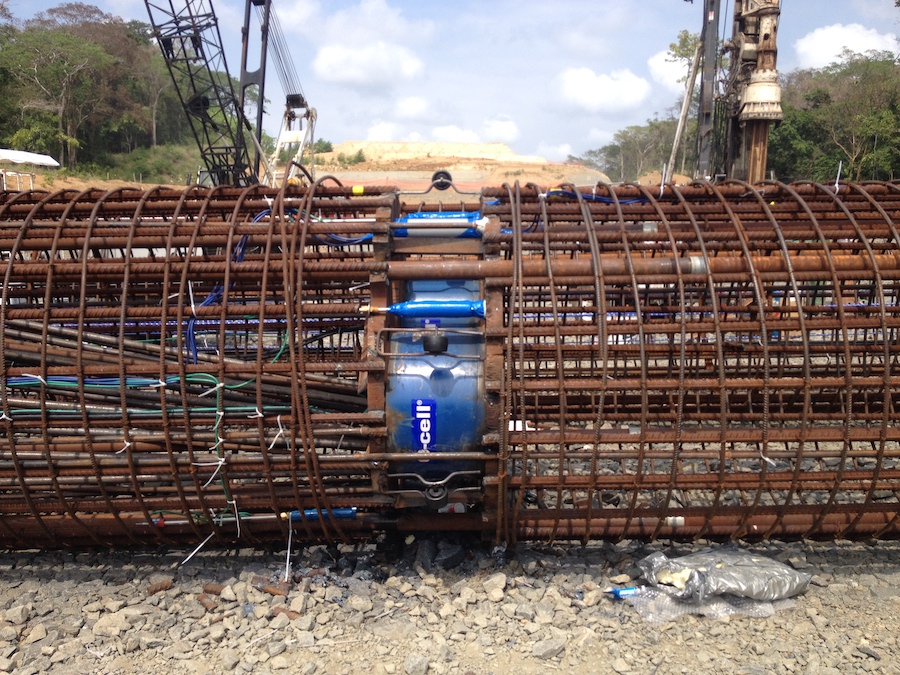
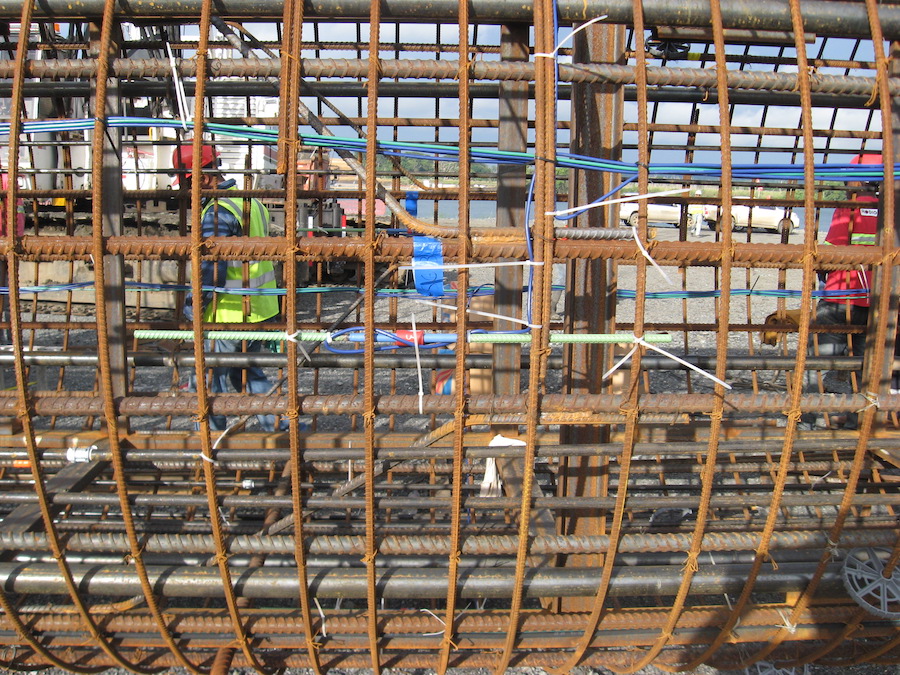
Each test shaft was carefully evaluated to ensure that the design requirements would have optimal chance of being answered. Based on projected load responses the O-Cells were located at the shaft resistance balance points calculated from the geotechnical materials above and below the cell location. Photo 2. shows O-Cell placement within a reinforcing cage structure at the balance point for a specific test location. Multiple O-Cells, operating in parallel at the same level, were used to achieve the needed loading for the most economical setup.
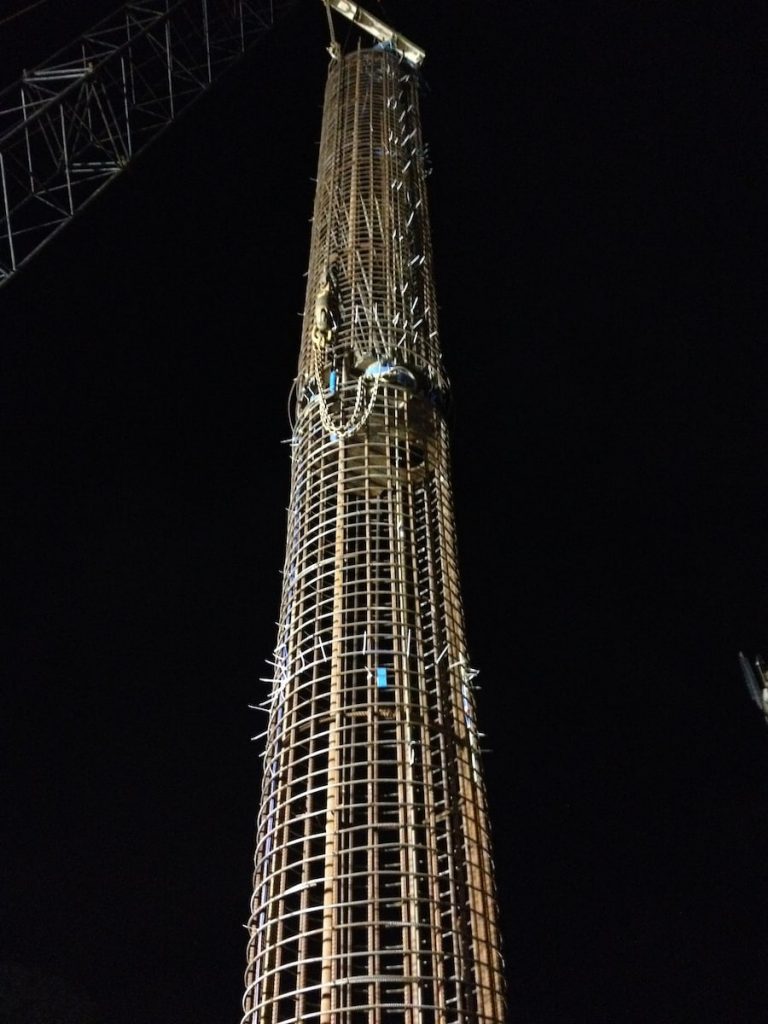
Careful consideration is always advised for lifting of cages for test shafts to prevent damage to the cage, instrumentation or O-Cell assembly. Photo 3. shows a successful test shaft cage lift ready for installation into the shaft excavation.
Excavation preparation is vital to quality shaft construction and for its performance, both test and production. Knowledge of the excavation verticality, alignment shape and volume are key to shaft quality and correct interpretation of load test shaft results. Knowing the correct shaft area at the location of interest is very germane for the correct interpretation of strain measured during a test program. Inaccurate areas applied to measured strains result in incorrect load distributions which can easily lead to unsafe production shaft designs.
Fugro Loadtest used it’s Sonicaliper to measure the test shaft profiles to accurately determine shaft shape for interpretation of load test results. The Sonicaliper rotating head uses from 40 to 300 points to determine shaft diameter at each level measured, producing accuracy far exceeding that measured with only a few points. Sonicaliper operates as an independent plumb bob, free of construction equipment influence, which also makes the equipment available for other construction activities.
 It is proven that errors from insufficient data points at one level can introduce significant area/volume errors for the entire shaft calculation. These errors compound by inducing errors into load distribution analysis for the strain gage data. With the safety of a mega structure such as this bridge is at risk, the best information is demanded.
The Sonicaliper information helped the team evaluate the challenges experienced while drilling the Gatun Formation. As exhibited in Figure 1. the formation initially caused difficulty with maintaining verticality and alignment on the large diameter shaft for test shaft 3 East. Without this accurate Sonicaliper information the team would have been operating in the dark on the influence the issue would have on construction methods, interpretation and application of load test results. This was a detriment to confident safe final design of production foundations.
The Team opted to reconstruct test shaft 3 East because of the quality issues caused by drilling difficulty in the formation and the influence it would have on the test pile and project final design. Figure 2. shows Sonicaliper logging information for the second test shaft excavation for location 3 East (22). While verticality still proved a challenge, the alignment issues were resolved allowing of a successful load test.
Instrumentation embedded in the pile captured data on the pile’s geotechnical response to the applied test loads. The instrumentation brackets the zones of interest in order to establish the capacity contribution each zone makes to the overall pile capacity during the test.
These test results are summarized in various curves that present the information such as the O-Cell Movement curve showing the movement of the upper and lower portions of the pile at the O-Cell during the loading sequence. Also presented are interpreted top down load curves, including one with elastic compression, showing the pile behavior under load. Figures 3. a & b, 4. a & b and 5. a & b display that information for test 1 East, 3 East & 5 West test shafts, respectively.
The test piles were tipped in the Gatun Formation. As may be seen the formation variations point to the importance site characterization and the development of the test program to address that variation for optimal final foundation design calibration. Table 1 gives some additional details on the variations of depths and total applied test loads for the project foundation load tests.
The information from the instrumentation allowed in-depth analysis of the test pile load transfer into the geotechnical materials which provided for foundation design optimization, thus maximizing geotechnical materials strength use. This optimized design saved time and money, while assuring that the rigorous foundation requirements the record-breaking concrete cable stayed structure needed were safely met.