Chapter 2 – Section 4: Soil Testing, Equipment
- Pile Buck Guide to Soil Mechanics and Testing
- Chapter 1 – Soil Mechanics Introduction
- Chapter 2 – Identification and Classification of Soil and Rock
- Chapter 2 – Section 1: Soil Formation, Physical Properties, Moisture
- Chapter 2 – Section 2: Soil Surveys, Maps, Investigations, Samples
- Chapter 2 – Section 4: Soil Testing, Equipment
- Chapter 3 – Laboratory Tests and Index Properties of Soils
- Chapter 3 – Section 1: Bituminous Mixtures
- Chapter 4 – Field Exploration, Testing, and Instrumentation
- Chapter 6 – Soil Seepage and Drainage
- Chapter 7 – Analysis of Settlement and Volume Expansion
- Chapter 8 – Slope Stability and Protection
From ‘FM 5-472 NAVFAC MO 330 AFJMAN 32-1221(I)’ by Department of the Army
SECTION VI. LIQUID LIMIT, PLASTIC LIMIT, AND PLASTICITY INDEX DETERMINATION (ASTM D 4318-95A)
Clays and some other fine-grained soils exhibit plasticity if the proper amount of water is present in the soil. A plastic soil is one that can be deformed beyond the point of recovery without cracking or change in volume. Such soils can be remolded. The LL is the greatest water content that the material may contain and still remain plastic. More water causes it to become a thick liquid. The PL is the lowest water content that the material may contain for plastic behavior. With less water, the soil becomes brittle and breaks into fragments if remolding is attempted. The PI is the numerical difference between the LL and the PL:
PI = LL – PL
A large PI indicates a very plastic soil; a small PI denotes a soil having little plasticity. As water content decreases below the PL, the soil mass shrinks and becomes stiffer. The shrinkage limit is the water content where, with further drying, shrinkage stops. Since there is no sharp distinction between the liquid, plastic, and brittle solid states of consistency, standardized procedures have been established for determining the LL and the PL. These consistency limits, as well as the shrinkage limit, are called the Atterberg limits. Since the primary tests in this section determine only the LLs and PLs and do not include tests for the shrinkage limits, they are not identified as the Atterberg limits.
Research with large numbers of clay soils was used to establish the soil plasticity chart for laboratory classification of fine-grained soils. The LL and PI values are coordinates that locate a particular soil sample on the chart. The region on the chart in which the sample falls gives the classification based on the behavioral characteristics of the particular soil.
Take particular care when performing the test methods described below. Some soils, particularly those with a high organic content, can provide inconsistent readings or drastic differences between an oven-dried sample and a sample at natural moisture content. Conduct the test below on samples of natural moisture content. Determine the moisture content at the end of the test.
LL Determination
A soil’s LL is the water content expressed as a percentage of the weight of the oven-dried soil at the boundary between the liquid and the plastic states and reported as a whole number. This boundary is arbitrarily defined by a standard test method. The test is performed on two halves of a prepared soil specimen in an LL device. The LL is determined when the soil halves flow together along a distance of 13 millimeters when the cup is dropped or jarred exactly 25 times from a height of 1 centimeter. This rate of drop is 1.9 to 2.1 drops per second.
Purpose
Perform this test to assist in classifying the soil by determining the LL from three moisture-content samples.
Equipment
Perform this test in a laboratory environment using the following items (see Figure 2-45):
- A balance scale sensitive to 0.01 gram.
- An LL device and a grooving tool (see Figure 2-46, page 2-92).
- A No. 40 sieve.
- Pudding pans.
- A ground-glass plate (at least 30 centimeters square by 1 centimeter thick) for mixing soil and rolling PL threads.
- A plastic bag.
- A calculator.
- Moisture-determination tares.
- Paper.
- A pencil.
- A grease pencil.
- DD Form 1209.
- Gummed labels.
- A spatula.
- A straightedge.
- A mortar with a rubber-tipped pestle.
- A laboratory oven.
- Heat-resistant gloves.
- Distilled water.


Steps
Perform the following steps to determine the LL:
Step 1. Prepare the soil sample.
a. Sieve the soil sample (at natural moisture content) over the No. 40 sieve to obtain a sufficient quantity of at least 250 grams.
b. Perform the following steps if little or no material is retained on the No. 40 sieve, otherwise go to step 1c:
(1) Collect 200 to 250 grams of –40 material for testing.
(2) Mix the material with distilled water until the water content is slightly below the LL or about a peanut butter consistency. The goal is to have the material fall in the 25- to 35-blow range for the first test.
(3) Place the mixture in a plastic bag, making it airtight for at least 16 hours (overnight) so the moisture content can become consistent throughout the sample. Remix the material thoroughly before testing.
c. Perform the following steps if material is retained on the No. 40 sieve:
(1) Place the –40 material in a plastic bag, making it airtight to maintain its natural moisture content.
(2) Soak the coarse material retained on the No. 40 sieve (the soaking time is variable).
(3) Rub the colloidal material from the surfaces of the large particles until they are clean, placing the fines in suspension.
(4) Pour off the suspended fines slowly into another pan, being careful not to pour off the coarse material.
(5) Add clean water to the coarse material and repeat the wash process until the water poured off is sufficiently clear to indicate that the majority of fines that were put in suspension have been poured off.
(6) Remove the excess water from the pan containing the suspended fines after the fines have settled by decantation and evaporation. Do not oven-dry or add chemical substances to speed dry or hasten the settlement.
(7) Oven-dry the coarse material that has been soaked and washed.
(8) Sieve the oven-dried coarse material over the No. 40 sieve.
(9) Combine the –40 material obtained from steps 1c(1) and 1c(8) with the decanted material from step 1c(6). If the combined material is too moist, air-dry it until the water content is slightly below the LL. If the combined material is too dry, add small quantities of water until the water content is slightly below the LL (peanut butter consistency).
(10) Place the combined mixture in a plastic bag, making it airtight for at least 16 hours (overnight) so the moisture content can become consistent throughout the sample. Remix the material thoroughly before testing.
Step 2. Inspect the LL device before testing.
a. Ensure that the pin connecting the cup is not worn (which would permit side play).
b. Ensure that the screws connecting the cup to the hanger arm are tight. c. Check the cup for wear. If a groove has developed from use, replace it.
d. Check the contact between the cup and the base. If a dent can be felt in the base or flat on the cup, replace or repair it.
e. Check the grooving tool for wear.
f. Check the height of the drop of the cup so that the point on the cup that comes in contact with the base (not the lowest point of the cup) rises to a height of 1 centimeter. Use the gauge on the handle of the grooving tool to assist in this measurement. The height of the drop must be 1 centimeter. Use the thumbscrew at the rear of the device to make an adjustment.
Example: The following is one procedure which could be used to aid in checking and adjustments:
1. Place a piece of masking tape across the outside bottom of the cup parallel with the axis of the cup-hanger pivot. The edge of the tape away from the cup hanger should bisect the spot on the cup that contacts the base. For new cups, place a piece of carbon paper on the base and allow the cup to drop several times to mark the contact spot.
2. Attach the cup to the device, and turn the crank until the cup is raised to its maximum height.
3. Slide the height gauge under the cup from the front, and observe whether the gauge contacts the cup or the tape. If the tape and cup are both contacted, the height of drop is approximately correct. If not, adjust the cup until simultaneous contact is made.
4. Check the adjustment by turning the crank at 2 revolutions per second while holding the gauge in position against the tape and cup. If a faint ringing or clicking sound is heard without the cup rising from the gauge, the adjustment is correct. If no ringing is heard or if the cup rises from the gauge, readjust the height of drop. If the cup rocks on the gauge during this step, the cam-follower pivot is excessively worn and the worn parts should be replaced.
5. Remove the tape after completion of adjustments.
Step 3. Perform the LL test.
a. Obtain about 50 grams of the 200- to 250-gram prepared sample, and place in an airtight container for use in the PL test.
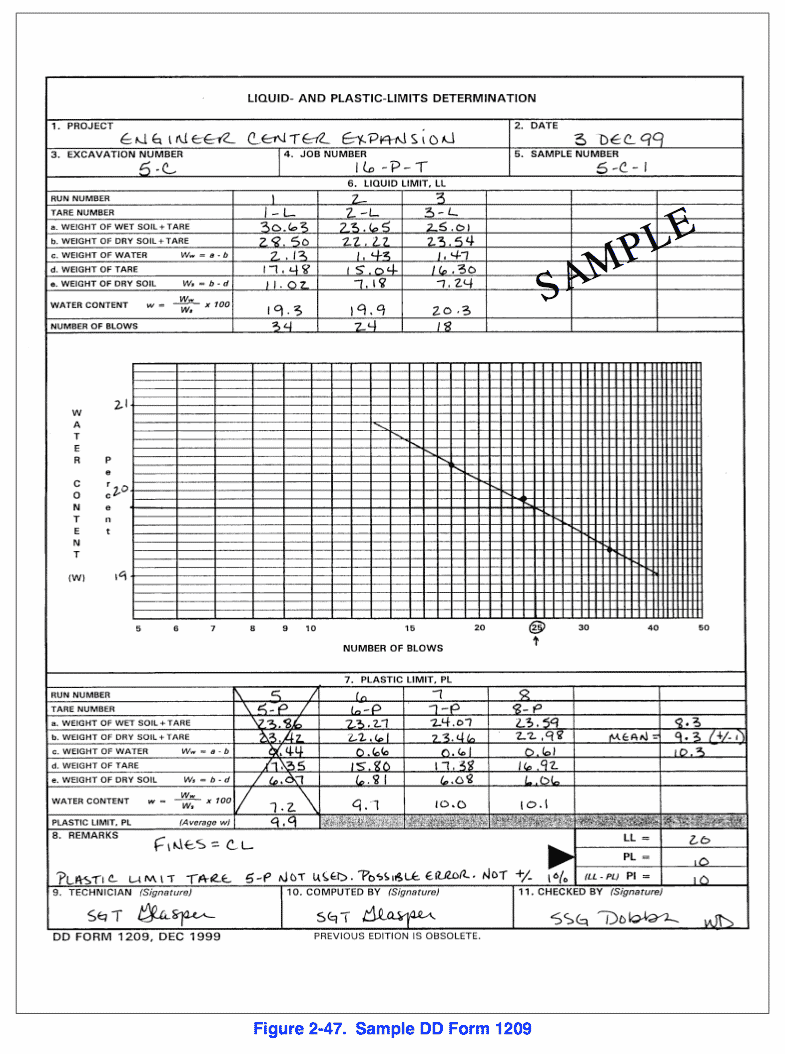
b. Record all identifying information for the sample on DD Form 1209 (see Figure 2-47).
c. Label and preweigh three empty moisture-determination tares. Record the weight on the form as the weight of the tare.
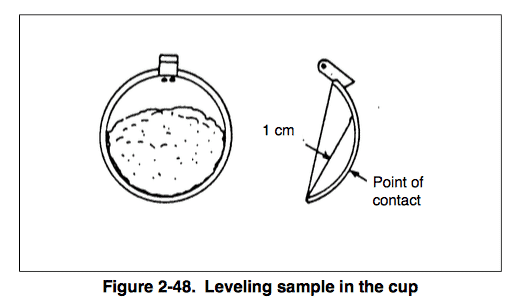
d. Place 20 to 25 grams of the thoroughly mixed sample into the brass cup, and level it off with a maximum depth of 1 centimeter (see Figure 2-48, page 2-96).
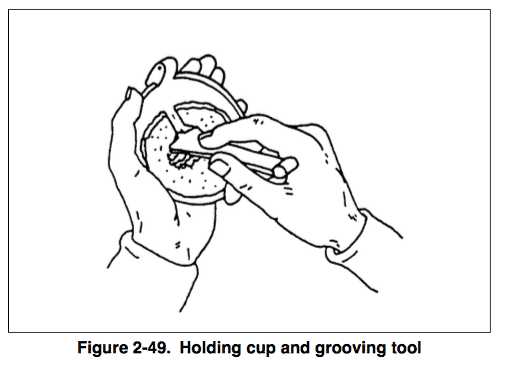
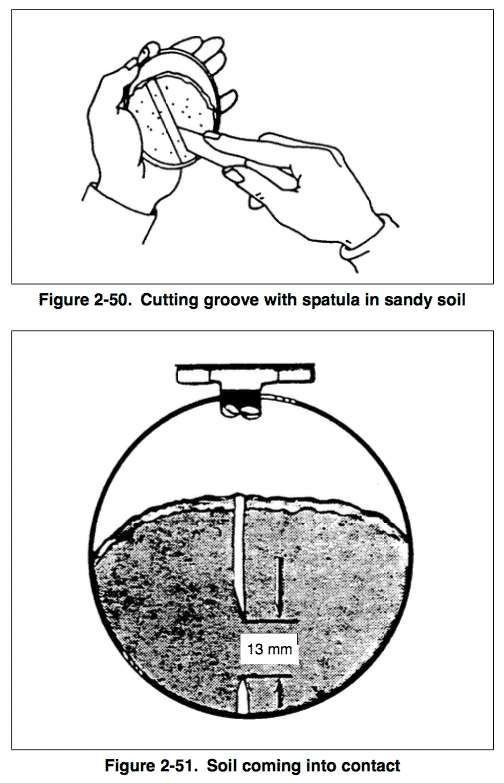
e. Divide the soil sample in the cup with a grooving tool so that a clean, sharp groove is formed. Hold the cup with the cam follower upward and draw the grooving tool, with the beveled edge forward, through the specimen downward away from the cam follower (see Figure 2-49, page 2-96). Use more than one stroke to make the groove, but no more than six, cleaning the grooving tool’s cutting edge after each stroke. Avoid tearing the side of the groove. Replace the soil sample in the cup, and regroove if the side tears. With some sandy and highly organic soils, it is impossible to draw the grooving tool through the specimen without tearing the sides of the groove. In such cases, the groove should be made with a spatula, using the grooving tool only for a final check of the groove (see Figure 2- 50).
f. Attach the cup to the device; ensure that the height of the drop is 1 centimeter.
g. Turn the crank of the device at a rate of two revolutions per second. Count the blows until the two halves of the soil make contact at the bottom of the groove along a distance of 13 millimeters (see Figure 2-51).
h. Record the number of blows to close the groove for 13 millimeters.
i. Obtain 5 to 10 grams of soil from the cup to determine the moisture content. Take the sample perpendicular to the groove from the edge of the cup and through the portion that has closed in the bottom of the groove. Place the sample in the preweighed moisture-determination tare, and cover it with a lid. Weigh it and record the weight on the form as the weight of the wet soil and the tare.
j. Transfer the soil remaining in the cup to the mixing dish. Wash and dry the cup and the grooving tool.
NOTE: It is recommended that one of the trials be for a closure requiring 25 to 35 blows, one for a closure between 20 and 30 blows, and one for a closure requiring 15 to 25 blows.
k. Remix the entire soil specimen, adding a little water to increase the water content of the soil and decrease the number of blows required to close the groove. Repeat steps 3d through 3j for at least two additional trials producing a successively lower number of blows to close the groove.
l. Oven-dry the water-content samples, allow them to cool, and reweigh them. Record the weight on the form as the weight of the dry soil and the tare.
m. Compute the weight of the water (Ww) by subtracting the weight of the dry soil and the tare from the weight of the wet soil and the tare. Record the weight on the form.
n. Compute the weight of the dry soil (Ws) by subtracting the weight of the tare from the weight of the dry soil and the tare. Record the weight on the form.
o. Record the water content for each specimen by computing the formula—
 NOTE: All weighing should be accurate to 0.01 gram and water contents computed in percent to one decimal place.
p. Plot the water-content points on the semilog graph on the form (water versus number of blows) and draw a straight line (flow line) representative of the three or more points.
q. Determine the LL by interpreting the graph where the flow line intersects the 25-blow line. Record the LL to the nearest whole number.
PL Determination
The PL of a soil is the water content, expressed as a percentage of weight of oven-dried soil, at which the soil begins to crumble when rolled into a thread 3.2 millimeters in diameter. About 50 grams of material is required for the PL test. Prepare the sample and set it aside while preparing for the LL test.
Purpose
Perform this test to assist in classifying the soil by determining the PL moisture content to within ± 1 percent.
Equipment
Perform this test in a laboratory environment using the same equipment listed in the LL determination test.
Steps
Perform the following steps to determine the PL:
Step 1. Label and preweigh two empty moisture-determination tares. Record the weight on DD Form 1209 as the weight of the tare.
Step 2. Obtain the 50-gram sample set aside during step 3a of the LL test. Reduce the water content, if required, to obtain a consistency with which the soil can be rolled without sticking to the hands by spreading or mixing continuously on the glass plate. The drying process may be accelerated by air-drying only.
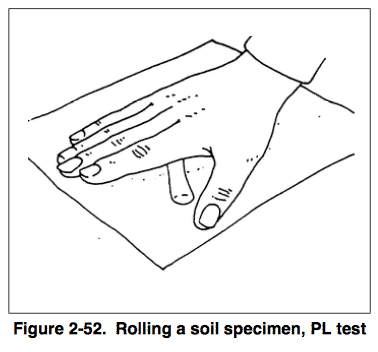
Step 3. Select a portion of about 2 grams (marble size) from the 50-gram mass and form the test specimen into an ellipsoidal mass. Roll it on a finely- ground glass plate with the fingers or palm of the hand to a uniform thread diameter of 3.2 millimeters, taking no more than 2 minutes (see Figure 2-52).
NOTE: The rate of rolling should be between 80 to 90 strokes per minute, counting a stroke as one complete motion of the hand forward and back to the starting position. This rate of rolling may have to be decreased for very fragile soil.
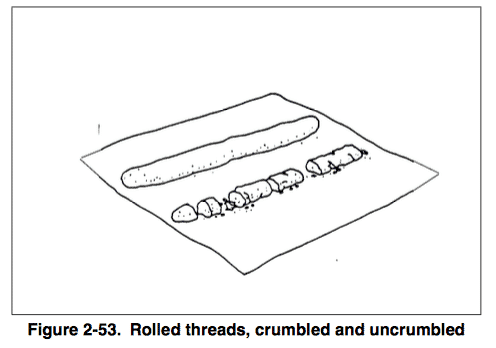
Step 4. Remold the sample and roll it again to 3.2 millimeters diameter, repeating the rolling and remolding process until the total sample crumbles, before reaching the 3.2-millimeters-diameter thread (see Figure 2-53, page 2-120).
NOTE: All of the sample may not crumble at the same time. If the thread breaks into smaller lengths, roll each of these lengths to 3.2 millimeters. Continue the rolling and remolding process until the sample can no longer be remolded and rolled to the 3.2-millimeter thread without totally breaking up.
Step 5. Collect and place the crumbled portions into a preweighed moisture- determination tare and cover it with the lid.
Step 6. Repeat steps 3 through 5 until the crumbled threads in the moisture- determination tare weigh at least 6 grams.
Step 7. Repeat steps 3 through 6 to obtain a second moisture-determination tare of at least 6 grams of material.
Step 8. Weigh the moisture-determination tares with the crumbled threads, and record the weights on the form as the weight of the wet soil and the tare.
Step 9. Determine the water content by following steps 3l through 3o (page 2-118) of the LL test.
Step 10. Determine the average water content of the samples and record to the nearest tenth as the PL. When determining the average water content, the individual tests must be within ± 1 percent of the mean. Any individual tests that do not meet this requirement will not be used. If none of the individual tests meet this requirement, then additional testing is required.
From ‘FM 5-472 NAVFAC MO 330 AFJMAN 32-1221(I)’ by Department of the Army
-
 SPW911 Sheet Pile Design Software
Rated 5.00 out of 5$150.00 – $599.99Price range: $150.00 through $599.99
 -
 Sheet Pile Design (PDF Download)
Rated 5.00 out of 5$89.00
 -
 Pile Driving (PDF Download)
$89.00
-
 Marine Construction Volumes 1 & 2 (PDF Download)
$157.00
-
 Pile Driving (Book)
$89.00


