Chapter 7 – Roads in Areas of Receding Shorelines
- Chapter 1 – Introduction
- Chapter 2 – Coastal Highways
- Chapter 3 – Tides, Storm Surge and Water Levels
- Chapter 4 – Waves
- Chapter 5 – Coastal Sediment Processes
- Chapter 6 – Coastal Revetments for Wave Attack
- Chapter 7 – Roads in Areas of Receding Shorelines
- Chapter 8 – Highway Overwashing
- Chapter 9 – Coastal Bridges
From ‘Highways in the Coastal Environment: Second Edition’ by FHWA
Chapter 7 – Roads in Areas of Receding Shorelines
7.1 – 7.2 – 7.3 – 7.4 – 7.5 – 7.6
Much of the American coastline is experiencing long-term recession. When a highway is near one of these receding shorelines, it can eventually be subjected to wave attack and erosion. This section outlines how long-term shoreline changes can be quantified and used to estimate future shoreline positions, ways to evaluate the vulnerability of coastal highways, the general options available for roadway relocation, and alternative shoreline stabilization techniques available for protecting a highway in place.
7.1 Examples of Issues
Figure 7.1 shows a roadway with a rubble mound revetment seawall protecting it from waves. In the 1970’s this road was located over 300 feet landward of the shoreline. The beach here is eroding at a high rate so that the shoreline has been moving toward the road at an average rate of 15 feet per year for the past 35 years. Shoreline recession progressively narrowed the beach until an emergency rock revetment/seawall was constructed. The revetment has not slowed the recession of the adjacent beaches. There are exposed tree stumps in the surf and on the beach face as a result of the recession. Shoreline recession has continued on both sides of the revetment and the road is extending farther out into the sea. The revetment is now protecting the road and functioning like an artificial headland.

Figure 7.1. A road initially built inland of a receding shoreline is now in the sea. Stump Hole area of Cape San Blas, Florida (2005 FDOT photo)
Figure 7.2 through Figure 7.5 show other examples of roads threatened by long-term shoreline recession. The problem occurs in a variety of coastal settings including coastal bluffs and low-lying barrier islands.
Figure 7.2 shows Cape Shoalwater area of Washington State Road 105 built along a rapidly receding shoreline. At the time of this photograph, 2001, there was a rock revetment at the base of the bluff and a groin in the background. There had been some limited beach nourishment.

Figure 7.2. A highway initially built inland now threatened by long-term shoreline erosion. (Cape Shoalwater area of Washington State Road 105, (2001))
Figure 7.3 shows a road on a narrow, low-lying barrier island in New Jersey. The road parallels the beach on one side and a back-bay wetland on the other. The shoreline here has been receding for decades and the road is threatened. Several shoreline stabilization and roadway protection projects have been attempted. The sand-filled geotextile tube was built and covered with a sand dune to protect the highway is being repaired after a storm in 2003.

Figure 7.3. A local road threatened by long-term shoreline recession. Ocean Drive, Whale Beach area of Cape May County Road 619, Ludlam Island, New Jersey (2003)
Figure 7.4 shows a local road undermined by bluff erosion on Lake Erie. This road used to continue straight ahead until bluff erosion undermined the pavement. The bluff erosion has been exacerbated by sand starvation of the beaches at the base of the bluff by an updrift jetty system.

Figure 7.4. A local road being undermined by bluff erosion and long-term shoreline recession on the Great Lakes. Painesville, Ohio, 2001
Figure 7.5 shows Texas Highway 87 along the east Texas coast of the Gulf of Mexico destroyed by shoreline recession. A twenty-mile stretch of this highway along the coast is now closed. It has been closed since 1989 when a storm caused significant pavement damage. Four-wheel drive access is permitted now but is not feasible when tides are high.
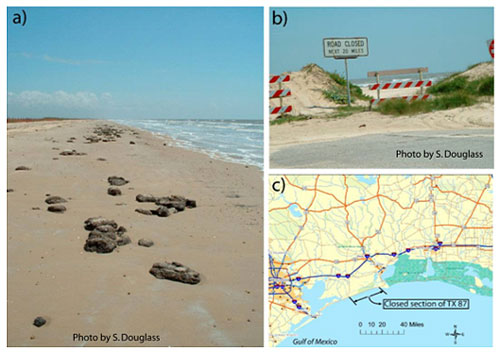
Figure 7.5. Road destroyed by shoreline recession: a) broken pavement on the beach at the old location; b) south end of the closed section; c) location map. Texas Highway 87, Jefferson County, 2002
7.2 Quantifying Shoreline Change Rates
Coastal erosion rates are often given in terms of the change in average annual shoreline position with time, e.g. 2 feet per year. These are actually shoreline change rates rather than erosion rates. The terms “recession” and “accretion” are typically used to describe the direction of shoreline movements. A beach that is widening in response to sand deposition has an accreting shoreline. A beach that is narrowing in response to erosion has a receding shoreline.
Shoreline change rates typically vary with location and time. Shoreline change rates should be looked over as long a time period as possible with as many observations as possible. “Long-term” shoreline change usually refers to multi-decadal time scales. Many observations in a single year can give some estimate of the seasonal variability in shoreline position as sand moves cross-shore on the profile. Typically these data are not useful for developing “long-term” shoreline change trends.
Historical shoreline data are available from a variety of sources including state coastal resource agencies, federal agencies that deal with the coast, and universities.
One example is the USGS results for the Atlantic and Gulf coasts (//coastal.er.usgs.gov/shoreline-change/2006). A state resource agency example is the State of Florida’s Department of Beaches and Coastal Systems database and analyses results (//www.dep.state.fl.us/beaches/2006).
There is no accepted national standard for shoreline change analyses. The quantity and quality of shoreline change data vary significantly. Each location has different types of historical data and analyses. The most problematic shoreline recession areas in the United States have likely been studied by a variety of agencies and researchers. Developing a clear understanding of historic shoreline changes for a project can require new analysis of existing data.
Historical shoreline positions can be measured by repetitive surveys or by remote sensing such as air photograph interpretation. Historical and current vertical air photographs can provide the basis for shoreline location data with proper interpretation and positioning analysis. One source for estimates of older historic shoreline locations is NOAA’s National Ocean Survey surveys and the surveys of their predecessor organization, the US Coast & Geodetic Survey (USC&GS). One example of the variability of historic shoreline positions from these surveys is shown in Figure 7.6. High-quality estimates of shoreline position can extend as far back as the 1850’s. The USC&GS significantly improved the accuracy of coastal surveys at about that time. Pre-1840 estimates of shoreline position done by the USC&GS are typically not as accurate as those done after 1850. USC&GS “t-sheets” and “h-sheets” are the summary plots of specific surveys and correspond with the dates of the actual survey. Navigation charts, however, are updated continuously and the date of the chart does not correspond with the date of all of the information shown on it. Accuracy of these historical shoreline estimates often can be adequate for the purpose of shoreline change analysis (Crowell, et al. 1991).

Figure 7.6. An example of historical shorelines based on USC&GS/NOS surveys updated with modern technology. Cape Shoalwater, Washington (Kaminsky, et al. 1999)
An example of a shoreline change analysis is shown in Figure 7.7. The plot is for five locations, spaced 1000 feet apart, centered on the location where the road in Figure 7.1 extends into the sea. The plot shows the measured shoreline locations through time and the lines are splines fit to the data for visual convenience. A recessional (negative) trend is obvious at all five locations and is very consistent at four of the five locations. There is some variability in the overall trend at station R-106 that may be explained by effect of the revetment protecting the road (the nomenclature and designations of the stations are those of the Florida Department of Environmental Protection). Given the natural temporal variability of shoreline location, the strong trends shown in Figure 7.7 are not typical. Similar plots often show much more variability through time and the trend is not always clear. The site analyzed in Figure 7.7 has a very clearly recessional shoreline. Figure 7.7 shows a non-linear trend in shoreline position through time. The recession rate appears to be greatest in the most recent years. A relatively large number of major storms have impacted this coast since 1997.

Figure 7.7. An example of shoreline position changes through time. Stump Hole area of St. Joseph’s Peninsula, Florida
More results from the same shoreline change analysis are shown in Figure 7.8. The average annual recession rate along 30,000 feet of shoreline on the west-facing shoreline of St. Joseph Peninsula is shown. The average annual rate depends on location and the time period over which the average is taken. Clearly the recession rate is much greater to the south (higher R-monument numbers).
Recession rates shown in Figure 7.8 have been calculated by the “end-point method” which averages the change in shoreline position from the beginning to the end of the time period. An alternative to the end-point method is linear regression (Crowell, et al. 1997). Linear regression is typically preferred to the end-point method because it uses all the available data and is less sensitive to one spurious or aberrant value.

Figure 7.8. An example of shoreline change rates along 30,000 feet of coast showing temporal and spatial variations but a significant recessional trend. Western-facing shoreline of St. Joseph’s Peninsula, Florida
7.3 Estimating Future Shoreline Positions
An estimate of future shoreline locations can be valuable in planning highways near areas of receding shorelines. The most common method for estimating future shoreline positions is direct extrapolation of historic shoreline change rates to the present shoreline (Crowell, et al. 1997). Figure 7.9 shows some historic shoreline positions as well as projected future positions at one location. The historic shoreline data was obtained from the FDEP on-line database. Florida originally obtained the older (1868 and 1934) data from the USC&GS, made appropriate datum corrections and added their own data from beach profile surveys. The projected shorelines are extrapolations from the 2005 shoreline location, at 1000 foot intervals along the coast based on the average annual rate of shoreline recession. The average annual rate of shoreline recession was based on the most recent 32 years (1973 to 2005). The result shows that more and more of the highway will be threatened by recession in the coming decades. This information and its graphical presentation, can be valuable in planning alternative responses.

Figure 7.9. Example of projected future shoreline positions at Stump Hole (FDOT figure)
7.3.1 Shortcomings of Shoreline Change Assumptions
There are theoretical and practical shortcomings with the underlying assumptions in using historic shoreline change rates to estimate future shoreline position. They include:
- Natural shoreline change processes are often not linear in time.
- Engineering may have influenced historic shoreline changes.
- Engineering may influence future shoreline changes.
It has long been recognized that shoreline change can be episodic. An individual storm may cause significant erosion or even trigger the beginning of an erosional period. The natural dynamic equilibrium on some beaches involves years of recovery after major storms. Large storms on low-lying barrier islands can cause island rollover and migration. Large storms on some coasts may remove large amounts of sand from the beach, via longshore and cross-shore sand transport and cause bluff erosion. Subsequent times of lesser storm activity can result in the replacement of much of that sand by similar processes.
Shoreline position in many US locations has been influenced either positively or negatively by engineering works. Engineering works can include seawalls, groins, breakwaters, inlet jetties, dams (on the US West Coast), dredging of ship channels, and beach nourishment. For example, a groin that traps sand will often widen an updrift beach while narrowing a downdrift beach. Over 1 billion cubic yards of sand have been trapped or removed from US beaches by the works of man (Douglass, et al. 2003). Beach nourishment projects can widen beaches significantly. Roughly 0.5 billion cubic yards of sand have been placed on 200 areas along the US coast (Campbell and Benedet 2004).
7.3.2 Sediment Budgets
Sediment budgets can be used to estimate future shoreline positions. Sediment budgets are estimates of the rate at which sand is entering, leaving a specific reach along the coast. The difference between the volume entering and the volume leaving an area yields the volume gained or lost by that area. Sediment budgets typically require much more data and analysis than simple shoreline change extrapolation. An example coastal sediment budget for Florida’s St. Joseph’s Peninsula is shown in Figure 7.10. Sediment budgets are often developed to understand a specific erosion problem and to develop alternative solutions. Input data usually include historic shoreline change rates or beach profile data. The sediment budget shown in Figure 7.10 was based on volumetric changes between 1973 and 1997. The sediment budget shows that the “Stump Hole” area just north of R-110 is losing an average of 185,000 cubic yards of sand per year. This is the cause of the shoreline recession threatening the road in Figure 7.1.

Figure 7.10. Example of a coastal sediment budget (Coastal Tech and Preble-Rish, Inc. 1998)
7.4 Vulnerability Studies for Coastal Roads and Bridges
Some fraction of the over 60,000 highway miles in the United States that are occasionally exposed to coastal waves and surge have already been damaged and will be damaged in the future. “The long-term expectation of continued highway damage requires comprehensive and continuing studies of highway vulnerability” (AASHTO Highway Drainage Guidelines 1999). Clearly, some of these coastal road miles are more vulnerable than others. Planning decisions related to repair, protect, or relocate these highways may be accomplished in a cost-effective manner based on a vulnerability study.
The decision to repair, protect, or relocate coastal highways requires an assessment of many variables including shoreline recession rates, protection afforded by existing and projected beach width, dune size, bluff geology, present and future transportation needs, and costs. A systematic method to anticipate future erosion problems along coastal highways and to evaluate responses for their repair and protection needs to be developed. The following objectives should be addressed by such studies (AASHTO Highway Drainage Guidelines):
- Identify the relative vulnerability of highway actions in the coastal zone to long-term erosion including the effects of storms and hurricanes
- Evaluate feasible engineering solutions for protecting and repairing coastal highways.
- Review and document prior highway damage, causes, remedial actions, costs, and effectiveness of solutions.
- Develop and test a methodology for matching repair and protection strategies to highway sections for different vulnerability scenarios.
- Use the model to estimate the location of all vulnerable sections and identify protection actions and costs for a predefined planning period.
Details of the model depend on the local coastal processes threatening the highway. In areas where dunes protect highways, available dune erosion models can be used to evaluate the level of protection. Vulnerability means that the coastal highway is susceptible to excessive overwash or undermining of the highway base. Transportation officials usually perceive a vulnerability problem when maintenance crews are required to make repairs several times per year (AASHTO Highway Drainage Guidelines).
Coastal highway vulnerability models are built from two databases:
- A digitized map with elevations and shoreline position
- An estimate of long-term shoreline recession rates.
This data can be integrated and organized for presentation on base maps and spreadsheets. When completed, this data will identify specific locations of vulnerable highways (AASHTO Highway Drainage Guidelines). For example, Figure 7.11 shows transects evaluated for vulnerability along a portion of North Carolina Highway 12. Each transect was evaluated using a model that incorporated both long-term shoreline change rates and storm-induced dune erosion (Moffat & Nichol 2005).

Figure 7.11. Example of coverage for a vulnerability study (North Carolina DOT)
Highway vulnerability studies based on the dominant, local coastal processes have proven to be an effective planning tool. For example, much of the damage to North Carolina Highway 12 caused by Hurricane Isabel in 2003 occurred in areas previously designated as highly vulnerable “hot spots” (Overton and Fisher 2004a). The models used in North Carolina have been developed for that coast using some of the principles and tools (SBEACH, ADCIRC, Kriebel’s dune erosion model, etc.) outlined earlier (Judge, et al. 2003, Krynock, et al. 2005).
Vulnerability study methodology should evolve as part of a permanent highway assessment program. For example, North Carolina’s methodology has been refined through time with the inclusion of modern research results (Stone, et al. 1991, Overton and Fisher 2004b). As another example, Florida DOT began a process of evaluating the vulnerability of all their coastal bridges after the hurricane of 2004 and 2005 proved that some were vulnerable to waves on storm surge.
7.5 Relocation Considerations
One obvious solution to the problem of a roadway threatened by shoreline recession is to relocate the road. Roads have been moved or abandoned at different locations along the US coast for decades. One example is Washington State Road 105 in the Cape Shoalwater area (see Figure 7.1). This road was moved several times since this area has experienced some of the highest, long-term shoreline recession rates in the nation. In 1998, a rock groin and revetment were built to protect the existing highway. Relocation of the road had again been considered but not selected as the preferred alternative.
One example of an abandoned road is Texas Highway 87 between High Island and Sabine (see Figure 7.5). The road was closed indefinitely due to damage by Hurricane Jerry in 1989. Prior to that, the road had been damaged repeatedly by coastal storms. A road in that location had been there for over a century and the local government in Jefferson County is working to re-open the road.
A primary issue when considering road relocation is the new route. The logical location is farther inland from a receding shoreline. However, those areas are often already occupied by private property or wetlands. Developing private property is extremely expensive due to its location near the coast. Wetlands maybe productive coastal wetlands protected for their habitat value.
The stretch of Texas Highway 87 that is closed today is in front of wetlands that are part of the McFadden National Wildlife Refuge. Relocating the road landward would require filling the wetlands. Likewise, relocation of CR 30E in the Stump Hole area of Cape San Blas (see Figure 7.1) would require the filling of wetlands currently managed by the state as an aquatic preserve. Alternative relocation options considered for Washington Highway 105 in the Cape Shoalwater area included private cranberry bog farms.
7.5.1 Shoreline Stabilization Options
An option along a receding shoreline is some form of shore stabilization or protection. Stabilization is essentially holding the line and resisting the recession. The shore protection generally is in one of two forms. One, some form of “hard” structural shoreline protection such as a seawall or groins or breakwaters. Two, some form of “soft” sand shoreline protection such as beach nourishment. There are many combinations of structures with nourishment.
7.6 Coastal Structures
Coastal structures can be categorized in terms of their primary function as follows:
- seawalls, revetments, bulkheads – shore-parallel structures on the shoreline designed to protect upland property from waves
- groins – shore perpendicular structures designed to control longshore sand transport
- breakwaters – shore-parallel structures located seaward of the shoreline to reduce the wave energy in their lee and to control longshore sand transport,
- hybrid structures – some functional combination of groins and breakwaters including “t-head groins” or “headland breakwaters”
Groins were probably the most common shoreline stabilization technique in the first half of the 20th century. Figure 7.12 and Figure 7.13 shows two groin fields. Groins are typically placed as shown in groups or “fields.” They are often called “jetties” but that term is typically reserved by the US coastal engineering community for structures that stabilize inlets. Groins can stabilize a shoreline via two mechanisms if there is adequate sand in the littoral system:
- Groins can locally realign the shoreline (shown in Figure 7.12) to reduce the longshore sand transport rate.
- Groins can shelter the area adjacent to them from the wave energy especially when waves approach the shore at an angle.
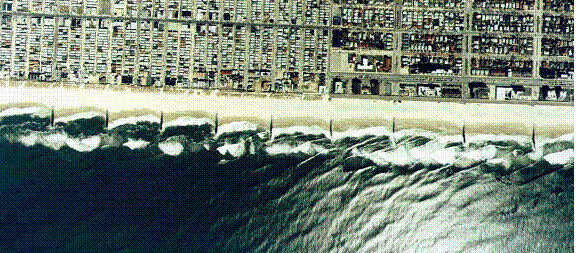
Figure 7.12. Groin field in Long Beach, New York (New York Sea Grant photo)

Figure 7.13. Groin field in Long Branch, New Jersey (2006)
Groins can trap sand on one side while causing erosion on the other. The shoreline on the updrift side of a groin accretes while the shoreline on the downdrift side recedes. Thus, groins are often built in groin fields so the one just downdrift stabilizes the next portion of the shore. Shoreline recession downdrift of the last groin at the end of a groin field can be severe (see Figure 7.14). Groins are much less acceptable today as a shoreline stabilization technique than they were prior to the 1960’s. New groins are discouraged or prohibited in many states today because of their potential downdrift negative impacts.

Figure 7.14. Severe shoreline recession and beach erosion downdrift of a groin field
(West Hampton, New York, circa 1985, New York Sea Grant photo)
7.6.1 Beach Nourishment
Beach nourishment is the placement of large volumes of good quality sand to widen a beach. Sand dunes can be constructed at the back of a nourished beach. “Beach nourishment is a viable engineering alternative for shore protection” (National Research Council 1995). Nourishment also has become the principal technique for beach restoration.
Figure 7.15 shows a beach nourishment project under construction. Sand is being pumped from an offshore dredge (not shown) to the beach and then down the beach to where the sand-water slurry discharges from the pipe. The beach is then shaped by bulldozers. As the new beach extends farther down the beach, the dredge pipe is extended.

Figure 7.15. A beach nourishment project under construction (Gulf Shores, Alabama, 2001)
Beach nourishment projects usually need to be maintained through subsequent renourishment as the sand moves out of the project limits. Many of the policy, management, and engineering issues related to beach nourishment projects are qualitatively described in Douglass (2002). Many of the quantitative engineering tools used in beach nourishment planning and design are presented in Dean (2002). The available quantitative tools for beach nourishment engineering for shoreline stabilization include methods for evaluating the performance of potential nourishment sands, estimating the short-term performance and the long-term renourishment intervals, and evaluating the ability of structures (if desired) to extend the renourishment interval. Each of these can be critical aspects of beach nourishment planning and design.
Beach nourishment projects protect a number of roads in the US. Two examples are shown in Figure 7.16 and Figure 7.17. The beach and dune in Figure 7.16 was constructed by the City of Delray Beach on top of the failed seawall shown in Figure 6.18. The sidewalk and parapet wall on the crest of the seawall in Figure 6.18 is the same as the sidewalk and bench shown in Figure 7.16. Since originally constructed in 1973 this beach nourishment project has protected the road while providing a beach. The site has been renourished four times since 1973.

Figure 7.16. Beach nourishment project with constructed dune on top of old, failed revetment protecting road (Florida Highway A1A, Delray Beach, 2001)
The nourishment project at Sea Bright, New Jersey, shown in Figure 7.17 is a federal shore protection project funded through the USACE’s shore protection authority. The beach was constructed in 1994 directly seaward of the seawall. Nourishment was the preferred alternative to further seawall repairs.
Proponents for beach nourishment projects have typically not been DOTs, even when the project protects a state highway. Rather, local government, a state resource management or economic development agency, the USACE, or a private entity typically sponsors beach nourishment. There have, however, been several beach nourishment projects sponsored or co-sponsored by a DOT.
The USACE shore protection program has the authority to consider and build either beach nourishment or seawalls to protect upland property. Almost all of the USACE’s federally authorized beach nourishment projects require a significant (35% to 50%) matching cost contribution from a non-federal sponsor. The USACE shore protection program typically has an annual budget of around $100 million and the program has not grown significantly during the past several decades.
Beach nourishment should be considered by transportation engineers where a road is threatened by a receding shoreline because of nourishment’s effectiveness and its broader societal benefits of aesthetics, recreation and environmental enhancement.

Figure 7.17. Beach nourishment seaward of a seawall protecting a road. (New Jersey State Highway 35, Sea Bright, 2001)
7.6.2 Combining Beach Nourishment with Structures
Modern coastal engineering shoreline stabilization solutions often combine beach nourishment with coastal structures. The purpose of the structures is to extend the interval between periodic renourishment. Some of these “hybrid” soft-hard solutions attempt to emulate natural geomorphological features such as pocket beaches and tombolos. The names of these “hybrid” solutions are still evolving.
Figure 7.18 shows a nearshore segmented breakwater with beach nourishment protecting a highway. This is the highway once protected by the concrete block revetment in Figure 6.19. The nourishment extends out to the nearshore breakwaters as tombolos forming a series of small pocket beaches.
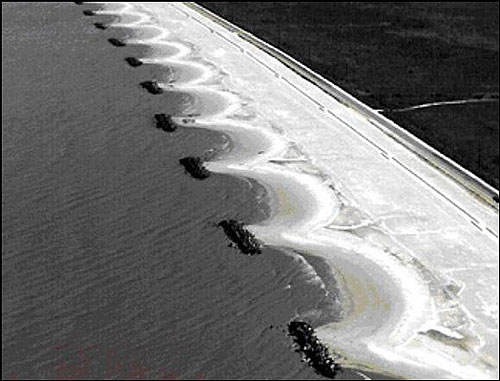
Figure 7.18. Offshore segmented breakwaters with tombolos in beach nourishment protecting a highway (Louisiana Highway 82, Holly Beach) (American Shore and Beach Preservation Association photo, circa 2003).
Figure 7.19 and Figure 7.20 show another system that uses nearshore segmented breakwaters and nourishment sand. In this system, tombolos do not form, the beach does not extend out to the breakwaters. The bulges in the shoreline in the lee of the breakwaters are called “salients.” This system reduces longshore sand transport in the lee of the breakwaters. The tombolos of the headland breakwater system shown in Figure 7.18 eliminate longshore sand transport, inside the breakwaters during normal conditions.
The formation of salients or tombolos is controlled by the geometry of the breakwater system as shown in Figure 7.21. The Coastal Engineering Manual (USACE 2002) provides more guidance on the functional design of nearshore segmented breakwaters.

Figure 7.19. Offshore segmented breakwaters with salients in beach nourishment (USACE archive photo, circa 1980).
Figure 7.22 shows a nearshore segmented breakwater system with terminal groins used to build a small recreation beach. The beach was created with nourishment on the bay side of a long seawall that protected a road but did not have any sandy beach. The breakwater and groin structure system were designed to retain the nourishment sand. The beach was built to provide access to the bay for wind surfers and others.
Figure 7.23 and Figure 7.24 show headland breakwater-pocket beach systems designed to retain beach nourishment sands on bay shorelines. Both were constructed in front of seawalls that had previously been damaged by erosion. These headland breakwater-pocket beach systems use structures to retain sand by providing artificial headlands. Figure 7.23 shows a headland breakwater that incorporates a “t-head groin” in the middle. The structures in Figure 7.24 do not include the stem of the “t” because tombolos were expected to form. The State DOT was a partial sponsor of the project in Figure 7.24 since the system protected a short stretch of road.

Figure 7.20. Offshore segmented breakwater system at Presque Isle, Pennsylvania
Functional design parameters for the design of headland breakwater-pocket beach systems include the distance offshore as well as the gap spacing. The functional goal is the creation of a pocket beach with the sand fill. The shorelines as shown in Figure 7.23 and Figure 7.24 are curved because they have responded to the wave energy coming through the gaps in the artificial headland structures. Wave heights and directions are modified as waves diffract through the gaps. The structure layout can essentially be “tuned” to the local, site-specific wave climate to produce a beach with a desired curved shape and width (Bodge 1998). More guidance for the design of these systems including methods for estimating the final equilibrium shoreline shape and location are given in Silvester and Hsu (1993) and Hardaway and Gunn (2000). An experienced, qualified coastal engineer is recommended for the design of these solutions which combine nourishment and structures.

Figure 7.21. Empirical guidance for shoreline effect of offshore segmented breakwaters. (after Pope and Dean 1986, and USACE 2002).

Figure 7.22. Offshore segmented breakwaters with groins and beach nourishment on Corpus Christi Bay (Ocean Drive, Corpus Christi, Texas).

Figure 7.23. Constructed pocket beach stabilized with a T-head groin breakwater system (Point Clear, Alabama).

Figure 7.24. Beach nourishment project stabilized as pocket beaches with a headland breakwater system protecting a road (Water Street, Yorktown, Virginia)
7.6.3 Non-traditional/Innovative Solutions
The history of coastal engineering has seen many innovative attempts at shore protection and stabilization solutions. These have included many expensive, patented devices and systems. Each of these innovative approaches functions differently but all must follow the same general principles of physics including mass (sand) conservation. If the placement of a device or apparatus in the surf causes beach sands to deposit, it functions much like the more traditional structures described above.
Some of the innovative solutions to beach erosion that have been tried are artificial seaweed, used tire breakwaters, different types and shapes of rigid submerged and emergent devices and beach dewatering. Most innovative solutions are serious attempts to address a challenging problem but some are unproven and highly questionable. Unproven, innovative shore protection solutions for highway applications should be pursued very judiciously.
While the evaluation of new innovative solutions to beach erosion problems should continue in the research and development community, prudent engineering planning and design should focus on proven solutions: relocation, nourishment, structures or some combination of those approaches.
-
 SPW911 Sheet Pile Design Software
Rated 5.00 out of 5$150.00 – $599.99Price range: $150.00 through $599.99
 -
 Sheet Pile Design (PDF Download)
Rated 5.00 out of 5$89.00
 -
 Pile Driving (PDF Download)
$89.00
-
 Marine Construction Volumes 1 & 2 (PDF Download)
$157.00
-
 Pile Driving (Book)
$89.00


